
Vessel Monitoring System for Indonesian Fleets

Your vessels are already producing data.MANTRAZ turns it into operational understanding.

Every engine, fuel line, tank, navigation sensor and onboard system tells part of the vessel's story. MANTRAZ brings those signals together so operations and management can see what is happening, understand the context and act with better information.

From vessel data to maritime intelligence.

Engine · Fuel · Position · Tank · Weather · Connectivity

Explore MANTRAZ
Signals→one platform→operational understanding

01 · The visibility gap

The data may already exist.The full picture often does not.

Vessel information can stay scattered across gauges, engine controllers, local displays, log sheets and separate systems. The challenge is not always collecting more data. It is making the existing data visible, connected and understandable.

Disconnected data creates delayed understanding.

Which vessel information still depends on someone calling the ship, checking a local display or compiling a spreadsheet?

One vessel6 data sourcesScattered signalsManual interpretationDelayed understanding

Each reading stays where it was measured: a gauge, a controller, a local display.

What management sees

“Fuel was high yesterday.”

Reported manually · next day

What context could explain

RPMSpeedVoyageWeatherEngine condition

The issue is not always missing data. It is missing visibility and context.

IllustrativeA typical vessel, today

02 · Discovery

We do not start with the product.We start with your fleet.

Every fleet is different. Engines, fuel systems, tank arrangements, available sensors, communication links, reporting needs and operating areas all shape the right solution. The first step is to identify what matters most to your operation.

Explore your fleet requirements
Fleet discoveryBefore any productQuestion 1 / 5
  1. 01

    What do you need to see?

    Current vessel, engine, fuel, tank, or environmental conditions.

  2. 02

    What must be measured?

    The parameters that influence operational decisions.

  3. 03

    What conditions need attention?

    Events, thresholds, or exceptions that should not wait for manual reporting.

  4. 04

    What needs to be explained?

    Fuel use, engine behaviour, voyage performance, or inventory change.

  5. 05

    What must connect to existing systems?

    Fleet applications, command centres, ERP, or internal platforms.

DiscoveryQuestions first. Configuration later.

Visibility starts by connecting the right signals.First, make the vessel visible.

03 · MANTRAZ

Platform. Solutions. Engineering.One connected vessel strategy.

MANTRAZ is more than a monitoring dashboard and more than onboard instrumentation. It combines a shared digital platform, maritime monitoring solutions and engineering capability to make vessel data usable in real operations.

The platform may be shared. The implementation is shaped by the vessel.

MANTRAZ

01

Platform

Data · Context · Analytics · Alerts · Reporting · API

Makes data usable.

02

Solutions

FMS · EMS · BMS · TMS · Weather · HLA · Custom IoT

Gives data operational purpose.

03

Engineering

Survey · Design · Installation · FAT · SAT · Commissioning · Support

Makes the system work on the real vessel.

Three parts · one system

04 · Digital vessel

A sensor reading is only the beginning.

A useful monitoring system must do more than collect signals. MANTRAZ connects field instrumentation, onboard data collection, communication, operational context, analytics, reporting and integration into one continuous information flow.

Data becomes valuable when the system understands what the number means.

One readingTB Nusa Aruna · ME PortStep 1 / 6Illustrative data
  1. 01SenseEngine · Fuel · Tank · GPS · Weather
  2. 02ConnectGateway · Cellular · Satellite
  3. 03ContextVessel · Engine · Port/Stbd · Voyage · Time
  4. 04AnalyzeTrend · Rule · Summary
  5. 05InformDashboard · Alert · Report · Mobile
  6. 06IntegrateAPI · Command Center · Internal Application

01 · SenseMeasure what is physically happening.

Fuel Flow26.8L/h

Raw signalA number, without owner, time or place.

02 · ConnectMove the data from vessel to platform.

GatewayCellular / SatellitePlatform26.8

In transitCollected onboard, sent when a link is available.

03 · ContextGive each reading meaning.

Fuel Flow26.8L/h

TB Nusa ArunaME PORTVoyage 02414:35

04 · AnalyzeTurn readings into trends, rules and summaries.

24 h trend · voyage average 27.1 L/hRule: within range

05 · InformDeliver the result to the right user.

Daily report · TB Nusa Aruna
ME Port · net consumption avg26.8 L/hVoyage 024

DashboardAlertReportMobile

06 · IntegrateMake the data available to other systems.

{ "vessel": "TB Nusa Aruna", "engine": "ME_PORT", 
  "fuel_flow_lph": 26.8, "voyage": "024", 
  "ts": "14:35" }

APICommand CenterInternal Application

05 · Fleet visibility

First, know where the fleet is,and whether the data is alive.

Position is only one part of fleet awareness. Speed, heading, last data timestamp, connectivity and device status help tell a moving vessel apart from a healthy digital connection.

Fleet visibility should show both vessel position and data health.

How quickly can your team tell a vessel issue from a communication issue today?

Fleet status8 vesselsLive
TB Nusa ArunaPosition receivedONLINE1 min ago
TB Segara WiraPosition receivedNO GPS4 min ago
LCT Tirta BaktiPosition receivedNO SENSOR2 min ago
MV Kencana TimurPosition receivedOFFLINE47 min ago
MT Bahari JayaPosition receivedONLINE1 min ago
Online
Latest vessel and device data are being received.
No GPS
Communication is available, but position data are not current.
No sensor
The gateway is reachable, but an expected device signal is missing.
Offline
No recent communication from the vessel.

TB Nusa Aruna · Java Sea

Speed
7.8kn
Heading
084°
ME RPM
1,080
Last data
14:35:02

A moving vessel and a healthy data connection are two different facts. Both should be visible.

Simulated fleetPosition every 60 s

Visibility is only the beginning.Now, understand the operation.

06A · Fuel measurement

Before fuel can be analyzed,it has to be measured correctly.

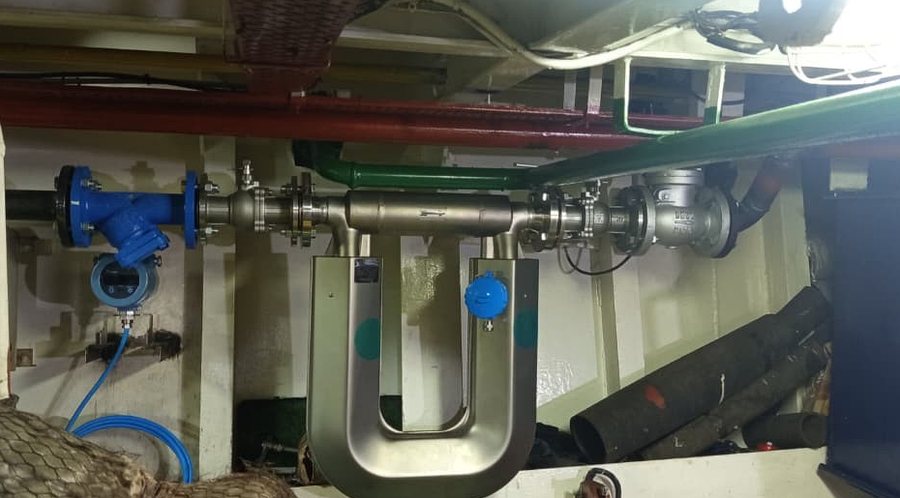
MANTRAZ measures fuel movement at the engine fuel system and turns it into a traceable consumption record. The measurement arrangement is selected according to the vessel's fuel system, engine configuration and engineering survey.

Supply flow − Return flow = Net fuel consumption

TB Nusa ArunaME Port · fuel systemExample: IN / OUT measurement arrangementLive
DAILY TANKSUPPLY →← RETURNFMFM128.4 L/h101.0 L/hME PORTMAIN ENGINENET 27.4 L/h

01 · How fuel reaches the engine

The pump sends more fuel than the engine burns.

The surplus returns to the tank. A single reading on one line cannot say what the engine actually used.

02 · What is measured

Supply flow Measured128.4 L/h
Return flow Measured101.0 L/h

Each flowmeter reads the flow at its own point on the line.

03 · How consumption is obtained

Supply flow128.4 L/h
−Return flow101.0 L/h
=Net fuel consumption27.4 L/h

27.4 L/h is what this engine used, not what passed one meter.

04 · Whose consumption it is

ME Port27.4 L/hMeasured
ME Stbd26.9 L/hMeasured
AE 1≈ 6.2 L/hEstimated
AE 20.0 L/hNot running

Every value belongs to one engine. Where an engine has no flowmeter, its fuel is estimated from running hours and labelled as such.

05 · What the record keeps · ME Port

Net consumption
27.4L/h
Consumed today
438.6L
Fuel temperature
42.1°C
Density
0.842kg/L

A traceable consumption record per engine, ready for context, voyages and reports.

Other arrangements, such as a single flowmeter with a reservoir, are chosen by engineering survey.Illustrative data

06B · Fuel intelligence

Knowing how much fuel was usedis only the first question.

The next is when, by which engine and under what conditions.

MANTRAZ places fuel consumption alongside engine operation, vessel speed, position, voyage and environmental conditions, so the same consumption number can be understood in its operational context.

Fuel tells you how much. Context helps explain why.

Do you only need to know consumption, or do you need to understand efficiency?

TB Nusa ArunaMain engine · Port14:35 · Live
Net consumption Measured
27.4L/h
Engine speed1,080 RPMEngine
Vessel speed7.8 knVessel
Sea conditionHead sea Environment
Net consumption+Engine speed+Vessel speed+Environment=Operational context

27.4 L/h is measured. On its own, it cannot say whether that is efficient.

Fuel tells you how much. Context helps explain why.

ME Port · measuredSupply − returnIllustrative data

07 · Engine intelligence

Running tells you the engine is working.Condition tells you how it is working.

MANTRAZ EMS can combine engine operation with condition data from onboard sensors or engine controllers, extending the view from RPM and running hours to temperature, pressure, exhaust, charging and other available signals.

Operation + Condition + History

Available parameters depend on the engine, existing controller, sensor availability and engineering scope.

TB Nusa ArunaMain engine · Port14:52 · Live
Operation+Condition+History

How is the engine being used?

How is the engine behaving while it runs?

How is its condition changing over time?

RPM1234
Engine speed
1,120RPM
Running hour
8h 42m
Operating mode
Cruise
Load band
Normal
1Cooling water
82°C
ECU / sensor · where supported
2Lube oil temp
76°C
ECU / sensor · where supported
3Lube oil pressure
4.8bar
Sensor · where supported
4Exhaust temp
384°C
Sensor · where supported
1Cooling water82 °C
2Lube oil temp76 °C
3Lube oil pressure4.8 bar
4Exhaust temp384 °C

−24 hNow

Running data show how the engine is used. Not yet how it is coping.

Temperature and pressure show how the engine behaves under that load.

Not only that the engine runs, but how its condition changes while it runs.

Varies by engine & sensor scopeIllustrative data

08 · Cross-system intelligence

One sensor gives a fact.Relationships between data give meaning.

Fuel monitoring (FMS) and engine monitoring (EMS) each report correctly on their own. Reviewed together with vessel speed and sea conditions, they help tell normal operational behaviour apart from a situation that deserves closer attention.

MANTRAZ provides the context for operational reasoning.

TB Nusa ArunaJava Sea15:10 · Live

Same vessel · same momentFour systems, four separate sets of facts

Scenario AConsumption rises. What else is changing?

Scenario BEngine condition changes at a similar engine speed

FMSFuel monitoring

Net consumption27.4L/hSupply − return · measured

EMSEngine monitoring

Engine speed1,120RPM
Cooling temp82°C
Oil pressure4.8bar

VESSELNavigation

Speed7.8kn5°54′ S · 109°24′ E

ENVIRONMENTWeather source

Sea stateHead seaNE 18–22 kn · 1.5–2.0 m
= Operational context= Operational context= Engine condition

Each reading is correct on its own. None explains the others.

Higher consumption may have an operational explanation.

The condition deserves attention and further technical evaluation.

Illustrative logic — not automatic fault diagnosis.Illustrative data

09 · Fuel accountability

Fuel should leave a digital trail.

Fuel management becomes more useful when bunker transactions, onboard inventory, engine consumption and adjustments can be traced as one continuous record instead of separate numbers.

Transaction + Inventory + Consumption = Fuel accountability

Can your current process explain not only how much fuel is onboard, but how that balance was formed?

TB Nusa ArunaFuel ledger · SepTanjung Priok
Opening stockPrevious ledger close · 01 Sep18.60KL
+Bunker receivedBunker event #024 · 14 Sep72.05KL
−Fuel consumedFrom engine fuel measurement · 01–30 Sep24.68KL
±AdjustmentTank reconciliation · 30 Sep−0.17KL
=Remain On BoardLedger balance · 30 Sep 18:0065.80KL

Every balance starts from a known opening stock.

Bunker monitoringMeasure and record incoming fuel transfer as a defined operational event.

Bunker event #02414 Sep · 06:10–09:45
Target72.00Order
Flowmeter72.40Measured
Tank / Sounding71.80Tank
Adjustment −0.35 KL→Final recorded 72.05 KL
Consumption · 01–30 SepFrom FMS
Main engines Measured
22.58KL
Auxiliary engines Estimated
2.10KL

Consumption from engine fuel measurement draws the balance down, hour by hour.

Tank monitoringProvide an independent view of physical inventory where the required tank measurement is available.

Ledger before adjustment65.97 KL
vs
Tank sounding65.80 KL

Difference recorded as adjustment · −0.17 KL

Remain on boardExplain how the current balance was formed from opening stock, bunker, consumption and adjustments.

Transaction+Inventory+Consumption=Fuel accountability
All volumes in KLIllustrative data

10 · Voyage intelligence

Vessel performance should be readin the context of the voyage.

Distance, duration, speed, engine operation, fuel consumption, wind, waves and sea condition can be reviewed together, so a voyage is assessed in the conditions in which it actually happened.

Performance must be interpreted with operating conditions.

When two voyages differ, can your current reporting explain what changed around the vessel?

TB Nusa ArunaTanjung Priok → SemarangSep
Voyage A03–04 Sep · departs 06:00
Voyage B17–18 Sep · departs 06:00

Same vessel, same route. Two voyages, two different results.

ABΔ B−A
Distance182 NM179 NM−3
Duration24.1 h25.0 h+0.9
Avg speed7.6 kn7.2 kn−0.4
Fuel usedME + AE1,470 L1,565 L+95 +6.5%
Fuel per distanceDerived8.1 L/NM8.7 L/NM+0.6
Sea conditionModerate Head sea —

Weather · external sourceA · Wind 8–10 kn, waves 0.5–1.0 mB · NE wind 18–22 kn, waves 1.5–2.0 m, against the course

Voyage B used 95 L more fuel for a slightly shorter distance: 8.7 against 8.1 L/NM.

Higher fuel use does not automatically mean lower efficiency.

Weather and sea conditions can change the effort required to achieve the same operational result.

ME measuredAE estimatedIllustrative data

Not every number needs attention.Some conditions do.

11 · Events & alerts

Management should not have to watch every number.It should know what needs attention.

Selected rules can evaluate incoming data and create events when configured conditions need attention. Each event carries the asset, parameter, severity, time, recovery and duration needed for follow-up.

Normal conditions stay quiet. Exceptions become visible.

Which events today are only known after the crew reports them?

EventsFleet · 8 vesselsLive
Active events
0
All vessels within configured rules8 vessels · no action needed
Critical
High-level alarmMT Bahari JayaFuel tank 02 · level 96 %
Active
Warning
Device offlineMV Kencana TimurGateway · last data 22:58
Active
Warning
Cooling temperature above configured thresholdTB Mahakam RayaME Port · coolant 92.4 °C
ActiveRecovered
Start 21:05Recovered 21:47Duration 00:42

Now

Active events1 critical1 warningFollow up while it happens

Over time

Event history14 events · last 30 days · for review

One exception surfaces. The other seven vessels stay quiet.

Severity sets the order of attention. Critical comes first.

Illustrative eventsRules configured per vessel
Data trustTB Nusa Aruna4 principles
  1. 01Measured
  2. 02N/A ≠ 0
  3. 03Freshness
  4. 04Traceability

Measured vs estimated · fuel today

Measured values come from installed measurement devices. Estimated values are derived from configured calculation methods and remain explicitly identified.

ME Port · Fuel consumption todayMeasured438.6L

Supply − return flowmeters · 00:00–14:35

AE 1 · Fuel consumption todayEstimated≈ 62.4L

Running hours × rated consumption · 10 h 04 min × 6.2 L/h

If AE 1 gets its own flowmeter, it becomes Measured

Both are useful. They should never look the same.

N/A vs zero

No installed sensor is not the same as a sensor reading zero.

AE 2 · Fuel flowN/ANo flowmeter installedNothing is measured here. The value is unknown.
ME Stbd · Net consumption0.0L/hFlowmeters read 0Flowmeters online. Engine stopped at anchor · 21 Sep.

Show a missing sensor as zero and every total and average it enters is quietly wrong.

Data freshness

The latest timestamp tells you how current the information is.

Last data
14:32:01
Now
14:32:13
Data age
12 s
Engine speed1,080 RPMFresh
Net consumption27.4 L/hFresh
Tank 02 level68 %Stale · 1 h 26 min

A precise number with an old timestamp is still an old number.

Traceability

One figure, followed from the report back to the reading.

ReportFuel report · 24 Sep · ME Port642.6 L
Summary24 hourly summariesΣ 642.6 L
Raw data1,440 records · 1-min intervalΣ 642.6 L
MeasurementSupply − return flowmeter27.4 L/h latest

Every figure in the report can be walked back to the reading behind it.

Illustrative dataQuality flags travel with the number

13 · Analytics

Live data tells you what is happening.History tells you what is changing.

Historical records turn individual readings into trends, operating patterns, voyage summaries, fleet comparisons and management reports: from a single reading to today's consumption, fuel per nautical mile, monthly trends and period comparisons.

History is not only an archive. It is the foundation for learning.

TB Nusa ArunaME Port · liveME Port · todayVessel · Voyage AVessel · SepVessel · Aug vs Sep14:35

What is happening now?

Net consumption Measured
27.4L/h
Live

Supply 128.4 − return 101.0 L/h

A reading describes one moment on one engine.

How much has it used today?

Total consumption Measured
438.6L
00:00–14:35
Area = 438.6 LL/h
00:0006:0012:0014:35

Accumulated over time, the rate becomes a total.

What did the voyage use per nautical mile?

Voyage ATanjung Priok → Semarang · 03–04 Sep

Voyage fuel ME + AE1,470 L
÷Distance vessel position track182 NM
=Fuel per distance Derived8.1 L/NM

24.1 h · avg 7.6 kn

L/NM exists only once fuel is tied to a voyage and the distance it covered.

What does a month look like?

ME fuel Measured
22,580L
Running hours
412h
Distance
3,130NM
ME fuel per distance
7.2L/NM
Derived22,580 L ÷ 3,130 NM
ME consumption per day · Port + Stbd
1 Sep15 Sep30 Sep

AE fuel 2,100 L · estimated, kept separate

Thirty days of readings become the numbers a manager reviews.

Period AAug · 30 dPeriod BSep · 30 dΔ
Distance 3,0503,130+80NM
Avg speed 7.37.6+0.3kn
ME fuel 22,32022,580+260L
Running hours 418412−6h
Avg engine speed 1,0651,080+15RPM
ME fuel per distance Derived7.37.2−0.1L/NM
  1. DescriptiveWhat happened?
  2. Diagnostic contextWhat was happening at the same time?
  3. Advanced analyticsWhat patterns deserve attention?

Historical data can provide a foundation for diagnostic and future predictive analytics where suitable models and validation are available.

ME · measuredAE · estimatedIllustrative data

The platform may be shared.The vessel is never generic.

14 · Connectivity

A connected vessel must alsobe designed for disconnection.

Vessels move through changing communication environments. The architecture can combine onboard collection, local visibility, cellular, satellite connectivity and data buffering according to operating area and data criticality.

Connectivity should follow the operating environment, not the other way around.

Where does your fleet operate, and which data must stay available when the link changes?

One platformThree vessels · three configurationsIllustrative configurations
MANTRAZ platformSame data model · Same dashboards · Same reports & alertsStandard
Vessel ATug
Engines
Twin ME
Fuel
IN / OUT flowmeters
Engine data
Existing ECU
Vessel BSupply vessel
Engines
Twin ME
Fuel
Single FM + reservoir
Engine data
Analog sensors
Vessel CSmall tanker
Engines
Single ME
Engine data
Existing PLC
Tanks
Tank monitoring

Measurement point · The platform stays the same. The instrumentation follows the vessel.

  1. 01Survey

    Understand the actual vessel.

  2. 02Engineering

    Define the correct instrumentation, panel, interface and installation method.

  3. 03Assembly & FAT

    Build and verify the system before mobilization.

  4. 04Installation

    Integrate the system onboard.

  5. 05Commissioning & SAT

    Validate measurement, communication, application data and operational behaviour.

  6. 06Training & support

    Prepare the user and maintain the system after handover.

Custom does not mean non-standard. The platform and the engineering method stay the same; the instrumentation follows the vessel.

Standard platform.Structured engineering method.Vessel-specific instrumentation.

16 · Implementation roadmap

You do not need to digitize everything at once.

A phased implementation can begin with the information that creates the highest operational value, then expand as data quality, user adoption and integration priorities become clearer.

Start where the visibility gap is most valuable. Expand when the data and users are ready.

Implementation roadmapPhased · cumulativeLayers in place 1 / 4
1

Phase 1

Visibility

Make the important conditions visible.

  • Position
  • RPM
  • Engine hours
  • Fuel
  • Selected engine health
Phase 1 · Visibility · later
2

Phase 2

Accountability

Make the information traceable.

  • Reports
  • Datalog
  • Bunker events
  • ROB
  • Alert history
  • Data quality
Phase 2 · Accountability · later
3

Phase 3

Operational intelligence

Connect the information into context.

  • Correlation
  • Voyage analysis
  • Baseline
  • Engine condition trend
  • Exception analysis
Phase 3 · Operational intelligence · later
4

Phase 4

Integration & scale

Connect MANTRAZ to the wider organization.

  • API
  • Command center
  • Internal applications
  • Fleet-wide standardization
Phase 4 · Integration & scale · later
Illustrative phasingEach phase keeps what came before.Scope and pace agreed per fleet

Start with the vessel.Build what the operation actually needs.

17 · Your fleet

The right digital system startsby understanding the vessel.

Before defining the final MANTRAZ configuration, we map the fleet, engines, fuel system, tanks, available signals, communication environment, reporting needs and integration requirements.

Fleet discoverySeven areas we map with youDiscovery map
01

Fleet

  • Vessel count
  • Vessel type
  • Pilot vessel
✓ In your exploration
02

Engine

  • Make / model
  • ECU / controller
  • Available health parameters
✓ In your exploration
03

Fuel

  • Supply / return
  • Existing flowmeter
  • Bunkering process
✓ In your exploration
04

Tank

  • Tank type
  • Geometry
  • Existing level measurement
✓ In your exploration
05

Connectivity

  • Operating area
  • Cellular
  • Starlink / VSAT / satellite
✓ In your exploration
06

Reporting

  • Operational report
  • Management report
  • Notification
✓ In your exploration
07

Integration

  • ERP
  • Command center
  • Fleet system
  • API
✓ In your exploration

The answers in these seven areas shape the final MANTRAZ configuration for your fleet.

  1. 01Fleet discoveryStart here
  2. 02Technical survey
  3. 03Requirement mapping
  4. 04Solution architecture
  5. 05Phased implementation plan
  6. 06Technical & commercial proposal

The proposal comes last, after the vessel and the operation are understood.

Nothing marked yet. Use Relevant to our fleet in the earlier chapters, or add a topic below. It helps us start the conversation from your fleet.

Add a topic

Explore MANTRAZ for your fleet

Your marked topics are included in the message, so the first conversation starts from your fleet.

MANTRAZ is not about collecting more data from the vessel. It is about making the right vessel data visible, understandable and useful for operation and management.

Overview

The Gap

See

Understand

Act & Trust

Build

O · ←→↑↓ · Enter · Esc

FAQ

Frequently asked questions

How long does MANTRAZ installation take?

Installation typically takes 7–20 days, depending on fleet size and the number of engines per vessel.

What gets installed on the vessel?

Sensors on the engine and tanks, an onboard gateway, and satellite or cellular connectivity to your dashboard.

What vessel types can it be installed on?

MANTRAZ is already installed on TB (tugboat), LCT, MV and AHTS vessels, and it suits other vessel types too.

Does MANTRAZ need a constant internet connection?

No. Vessels beyond cellular range switch to satellite mode, which still sends GPS position, engine RPM and auxiliary engine readings; flowmeter fuel, temperature and power meter readings resume once the vessel is back in cellular or Starlink range.

Which readings are measured and which are estimated?

Main engine fuel is measured by flowmeters on the supply and return lines. Auxiliary engine fuel is usually estimated from running hours, and reports keep measured and estimated fuel apart.

What support do we get after installation?

MANTRAZ support is available 24/7.

How much fuel can we save?

It depends on the vessel and how it operates. MANTRAZ measures fuel per engine and ties it to the voyage and operating conditions, so you can see where fuel goes and act on what the data shows. We do not promise a fixed percentage.

Is our data shared with charterers?

Charterers only get a GPS Viewer account showing position and track history for the vessels assigned to them — no fuel data, bunkering or reports.

How do we get started or see a demo?

Request a demo on WhatsApp, or log in if you're already a MANTRAZ customer.